
Once a risk assessment and analysis of its findings have been completed, the team responsible for the task must report the findings to the appropriate audience. In terms of cyber risk management, this usually includes the board of directors, senior management, IT staff, and any third-party managed security service providers (MSSPs) or IT contractors. Risk reporting ensures that the findings of the risk assessment are communicated to these audiences in a way that is understandable to them and emphasizes the severity and urgency of the risks discovered.
Beginning with a classic enterprise risk management (ERM) report is usually a good first step. This is a simple document written in professional prose and following a standard structure. This document is usually written for senior management and the board of directors. The ERM report should outline the big picture of the organization's current risk profile and its implications for the bottom line. The audience should gain a full understanding of the major risk categories facing the organization, as well as statistics on how similar risks are affecting other organizations within the same sector.
More specifically, an ERM report should contain the following:
- Executive Summary: A brief explanation of the uncovered risks and their implications.
- Risk Profile: A full picture of the organization's current risk level with the identified risks left unaddressed.
- Risk Appetite: A review of the organization's agreed-upon risk appetite.
- Risk Tolerance: Similar to risk appetite, a review of risk tolerance specifies the boundaries the organization has set within its risk appetite. This section should also compare the current risk profile against those boundaries and specify whether it is within or outside the established risk tolerance.
- Key Risk Indicators (KRIs): These are observations that indicate whether certain risks are materializing. Usually expressed as quantifiable values, KRIs help the organization understand how ingrained a risk is within its environment.
- Risk Trends & Impact Assessment: This section provides a summary of the current risk profile and its severity. The authors of the ERM report should use external sources such as threat intelligence and threat-hunting reports to predict how the identified risks will evolve over time. For example, the report may indicate that attacks against the company’s SMS-based MFA system will increase steadily over the next year. The impact of these trends should also be assessed to show how the organization's financial, operational, and reputational health may suffer.
The full findings of the risk assessment should be included in this ERM report. However, effective risk reporting requires additional methods to ensure the key points are understood by all audiences. Some of the most important individuals in the risk management process may not possess deep technical knowledge. Excessive technical jargon and complex figures may confuse them and result in the risk management process becoming convoluted. This is why risk reporting often makes heavy use of visualizations.
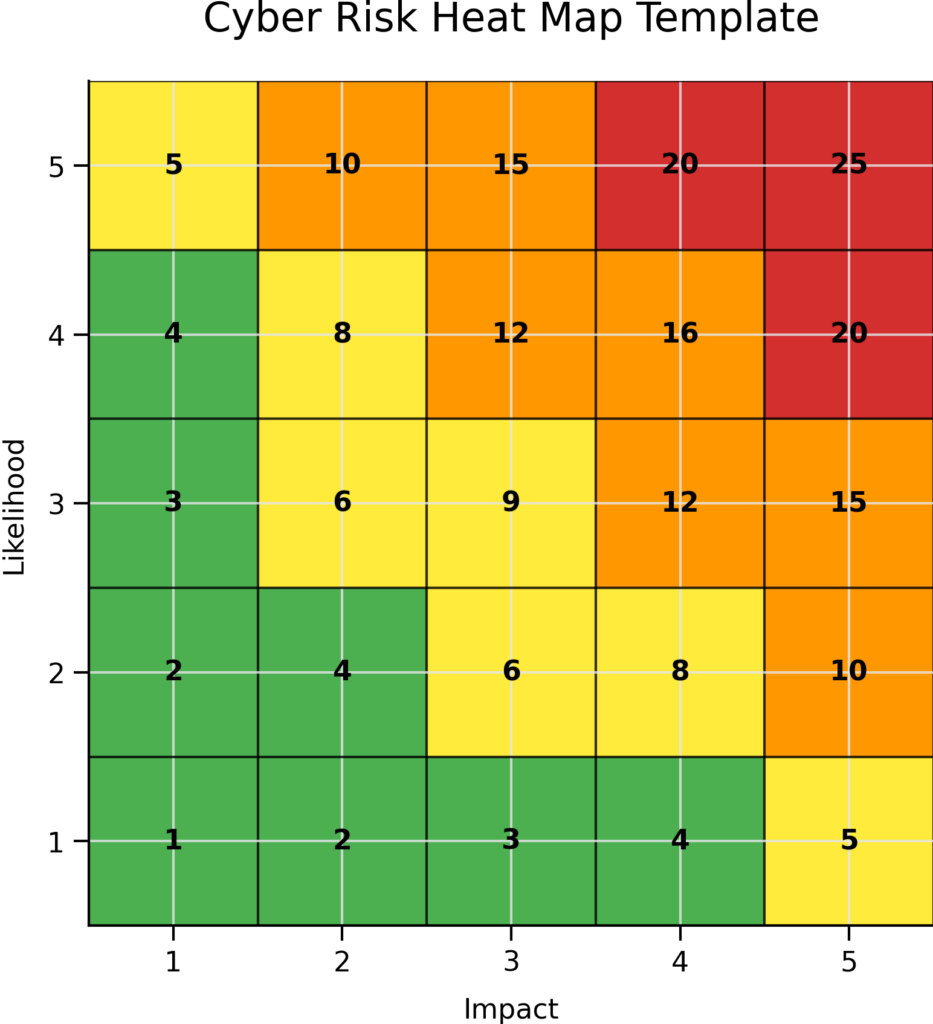
In the previous section, we discussed the risk matrix, a simple visualization that maps risks on a severity scale according to their impact and likelihood. A risk heat map is an evolution of the risk matrix. It uses color coding and category descriptions to emphasize the severity of risks. It follows the same structure as the matrix, using impact × likelihood as its underlying formula. Most risk heat maps use a five-point scale for impact and likelihood, with 1 representing the lowest severity and 5 representing catastrophic severity. In terms of color, green typically indicates the lowest-severity risks, such as those with an impact of 1 and a likelihood of 1, while red indicates the highest-severity risks, such as those with an impact of 5 and a likelihood of 5.
Risk management teams can make use of additional visualizations as needed to emphasize key points. Pie charts, scatter plots, Venn diagrams, and histograms are all classic visualizations used by organizations for reporting purposes. Teams can use these visualizations to highlight predicted losses, cyberattacks targeting the organization's sector over time, the number of public exploits released over time, snowballing fines for non-compliance, and similar trends.
All artifacts of the risk reporting process should be compiled into a dashboard, a central hub that organizes the different sections of the risk report within a visually appealing webpage. Here, detailed technical analysis can be combined with visualizations so that all audiences can understand the organization's risk profile. The dashboard should be made available on the organization's intranet and shared with the necessary personnel so that relevant parties can review the risks independently.
Once the results of the risk assessment have been compiled into a report and accompanying visualizations, the risk management team can finalize the risk priority ranking. Risk analysis will have already produced an initial severity ranking by calculating impact × likelihood. However, different levels of management may provide additional input that changes the priority ranking. For example, senior management may favor addressing a risk affecting the organization's website and social media presence due to public scrutiny, despite the fact that the risk is only ranked as medium severity. These kinds of decisions require careful debate and discussion among all relevant stakeholders, which is why meetings should be held to discuss the risk assessment findings.
Once a final ranking of risks has been created, the risk management team can create a risk register, another classic artifact of risk management. The risk register serves as a single source of truth for the organization's risks. The register lists all risks in descending order of priority and contains columns that specify:
- Risk Description
- Category (web-based risk, network-based risk, personnel-based risk, etc.)
- Impact
- Likelihood
- Risk Score (Impact × Likelihood)
- Risk Owner
- Response Strategy (Avoidance, Mitigation, Transference, Acceptance)
- Mitigation Plan (a description of the chosen security controls that will be implemented to address the risk)
You may notice that the last three attributes of the risk register entries have not yet been produced. The risk register is a living document that tracks uncovered risks throughout the risk management lifecycle. In the next document of this framework, risk responses and cybersecurity controls will be selected from the Stage 3: Implement Controls sheet. In addition, risk owners will be assigned to oversee and supervise identified risks.
All of these developments will occur progressively, meaning the risk register must remain continuously accessible and be regularly backed up. Over time, cybersecurity controls will reduce risks to acceptable levels, and these changes will be reflected in the register.
Once an initial risk register has been prepared with a comprehensive list of uncovered and prioritized cyber risks, the organization can move on to selecting countermeasures that will be integrated into the information security program to address those risks.
 Loading...

 Reload document
  Open in new tab